Building Entity Networks
Create powerful relationship graphs from scratch. Learn how to use auto-expand, timeline analysis, and export professional dossiers.
1. Starting an Investigation
Open the Research Workspace to begin:
1. Click **New Investigation** or open an existing one 2. Enter a seed entity (name, organization, vessel, etc.) 3. Select entity type from 44 available categories 4. The AI will search across 40+ sources automatically
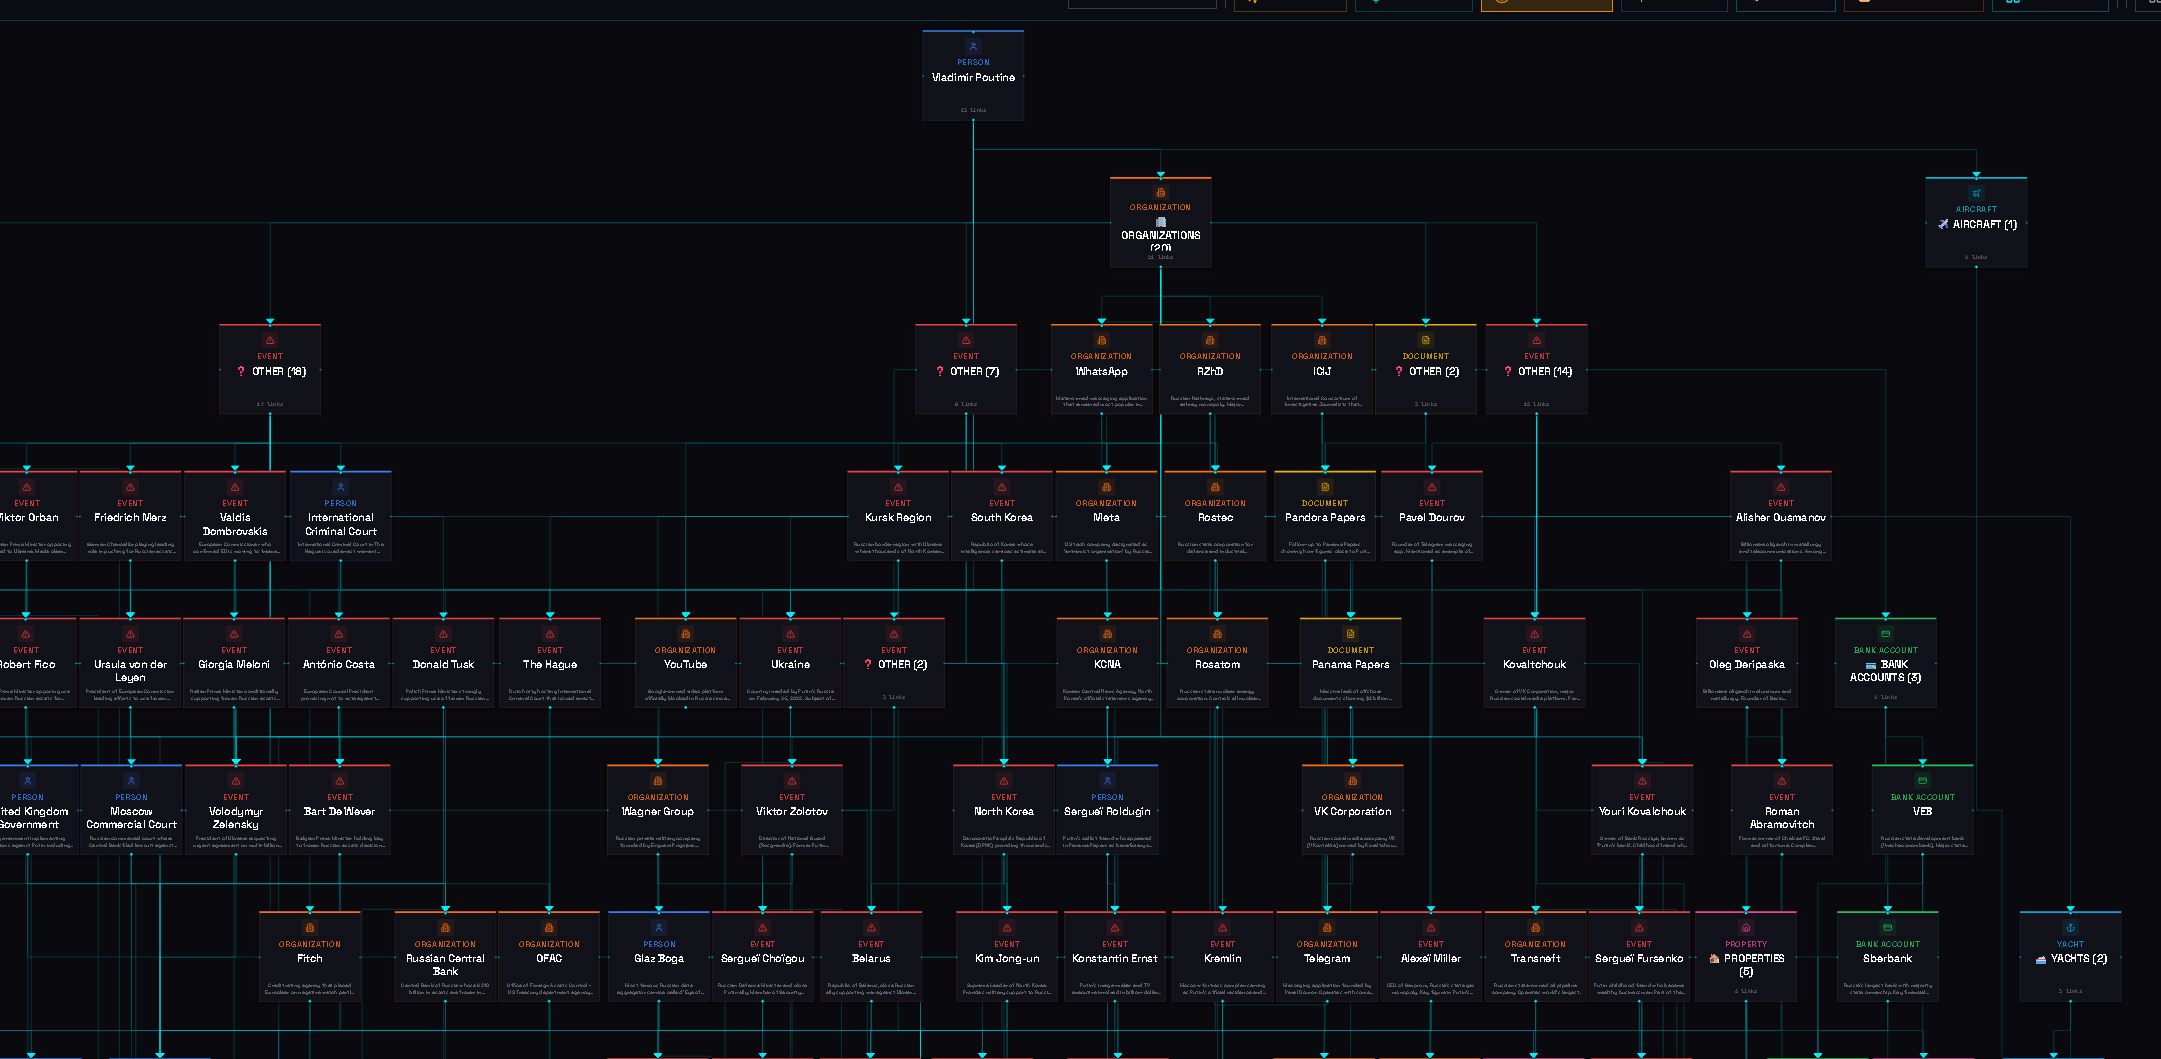
2. Understanding the Graph
The entity network graph visualizes relationships:
• **Nodes** — Represent entities (people, organizations, vessels, etc.) • **Edges** — Show relationships between entities • **Colors** — Different colors for different entity types • **Size** — Larger nodes indicate more connections
You can drag nodes to rearrange, zoom with scroll, and click to expand.
3. Auto-Expansion
Let the AI discover hidden connections:
• **Depth-1** — Direct connections to your seed entity • **Depth-2** — Connections of connections (recommended) • **Depth-3** — Extended network (may include noise)
SENTINEL supports 15 relationship types: ownership, employment, family, financial, legal, and more.
4. Timeline Analysis
Track entity activity over time:
1. Select an entity in the graph 2. Click **View Timeline** in the entity panel 3. The AI extracts dates and locations from sources automatically 4. Filter by date range or activity type 5. Export the timeline for reports
5. Compliance Verification
Cross-check entities against regulatory lists:
• **Sanctions lists** — OFAC, EU, UN sanctions • **PEP databases** — Politically Exposed Persons • **Adverse media** — Negative news coverage • **Watchlists** — Law enforcement databases
Results are classified: CLEAR / POTENTIAL MATCH / CONFIRMED MATCH
6. Exporting Dossiers
Generate professional outputs:
• **4 formats** — Executive Brief, Operational, Diplomatic, Full Analysis • **7 languages** — EN, FR, AR, ES, DE, RU, ZH • **Export types** — PDF, Word, PowerPoint • **AI conclusion** — Automated summary of key findings
Continue learning